USB Performance Monitor
- Posted by Simon Inns
- Posted on April 21, 2010
- PIC Microcontroller, USB
- 6 Comments.
Contents
The USB Performance monitor is a PIC18F2550 based device which shows the performance of your computer using two analogue meters and a RGB LED. The design is based around a stock Hi-Fi VU-meter which is controlled using PWM from the PIC18F microcontroller. This project was inspired by a friend of mine who wanted a way to move his computer’s HDD LED onto the desktop. After toying around with sending Windows performance counters over USB via the Generic HID protocol I came up with the idea of using a VU meter I had lying around to build a full USB Performance Monitor.
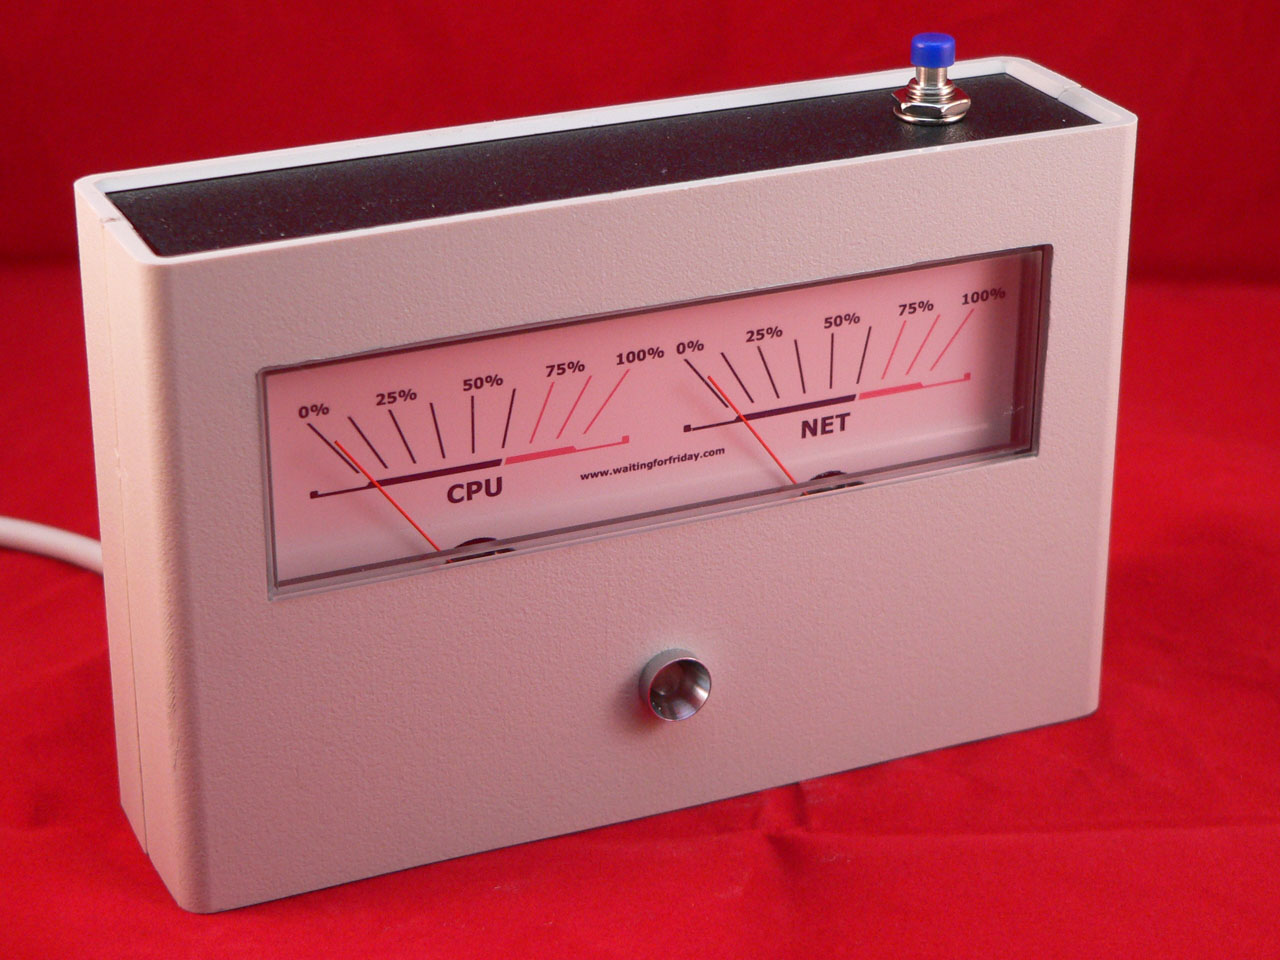
Even the HDD LED itself is ‘improved’ in this project. Instead of a single-colour flashing LED this project uses a RGB LED which varies its intensity based on the level of utilisation and its colour based on reading, writing or both. Lastly a single hardware button was added to allow you to quickly enable and disable the device without having to grab the mouse.
The PIC18F2550 firmware is written in Hi-Tech C and the Windows host software is written in C# using my Open Source Framework for USB Generic HID devices based on the PIC18F and Windows. As always, the software is GPL open source and can be downloaded from the section at the end of this article.
YouTube Demonstration Video
Hardware
PIC based USB device
The hardware is based around the PIC18F2550 microcontroller which has on-board USB. A minimal component count was used to connect the device to the USB port as well as to the switch, meters and RGB LED. The overall circuit schematic can be seen in the following diagram:
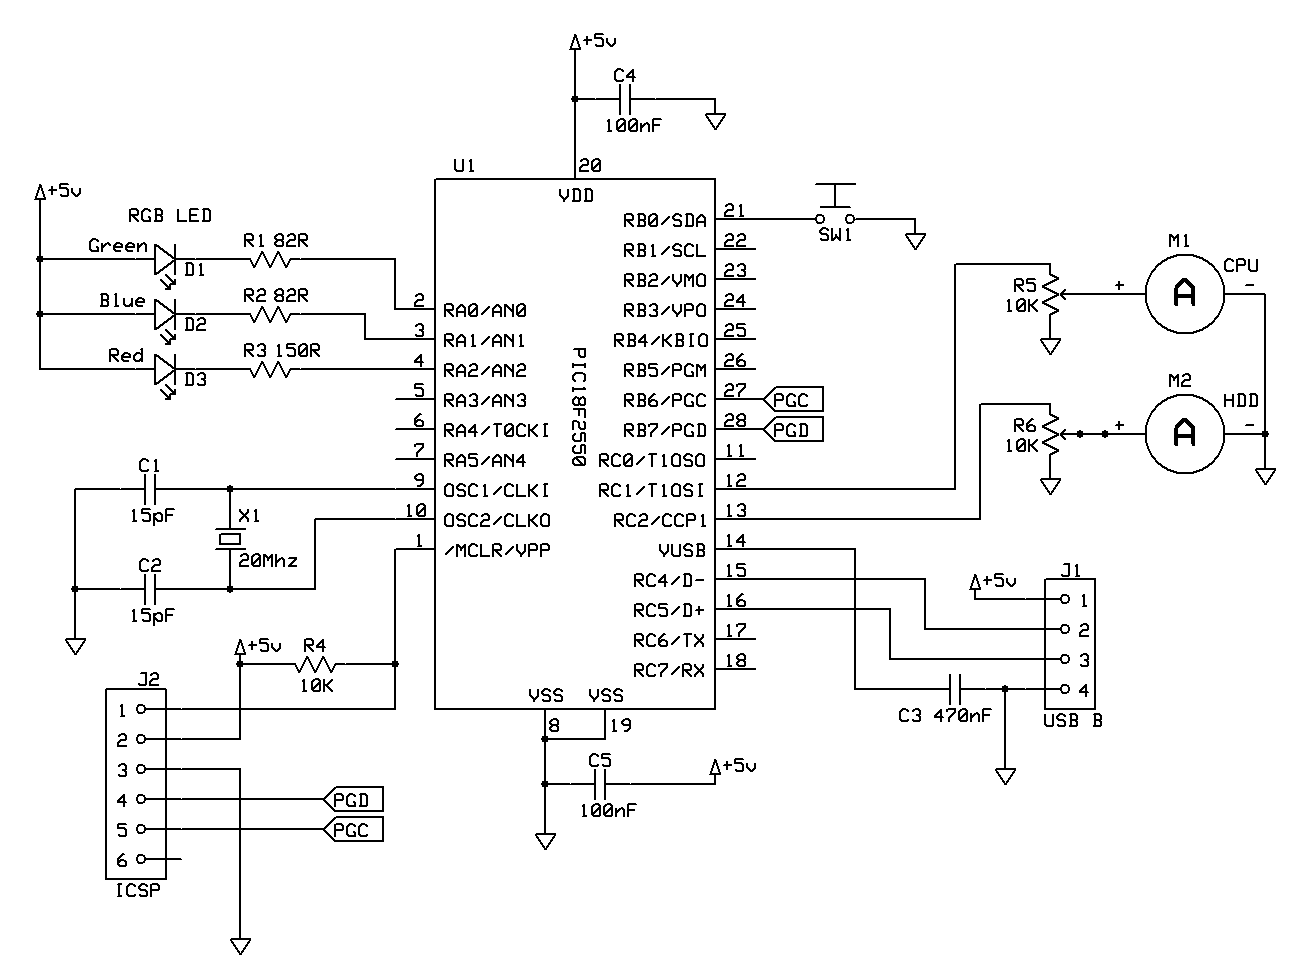
Two potentiometers are included in the design to allow quick calibration of the full-deflection power required by the VU-meter (as this can vary from meter to meter). Other than that the design is fairly straight-forward; the RGB LED resistors were chosen according to the data-sheet to allow the highest brightness from the LED since we will be controlling the output using PWM. The PIC is clocked at 20Mhz to allow the full 48Mhz PLL speed to be used, this is useful since PWM control of the LED requires as much processor speed as possible.
In order to fit the device in the smallest possible space I designed a single-sided PCB. However, the design is simple enough to be easily built on a piece of strip-board if you don’t have PCB etching equipment. Here is a picture of the PCB design:
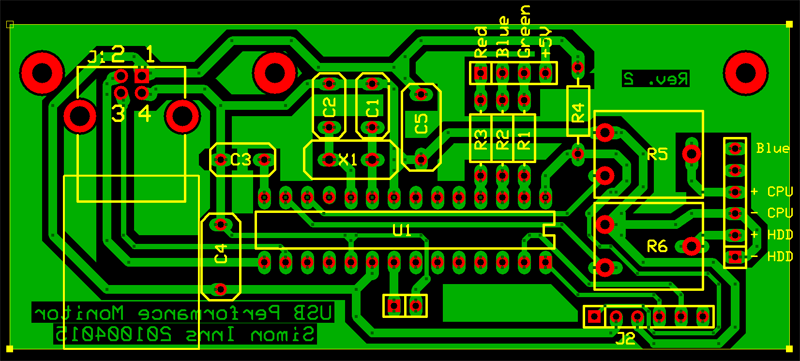
Note that the USB connector is facing downwards, this is to allow the connection to be plugged in inside of the case allowing the cable to be routed out the back of the device. This allows you to change the USB cable if required for a longer or shorter cable, however you could directly solder the cable to the PCB or use a different type of internal connection.
The PCB is designed to fit inside a Velleman G738 enclosure which I cut down a little to make it shorter.
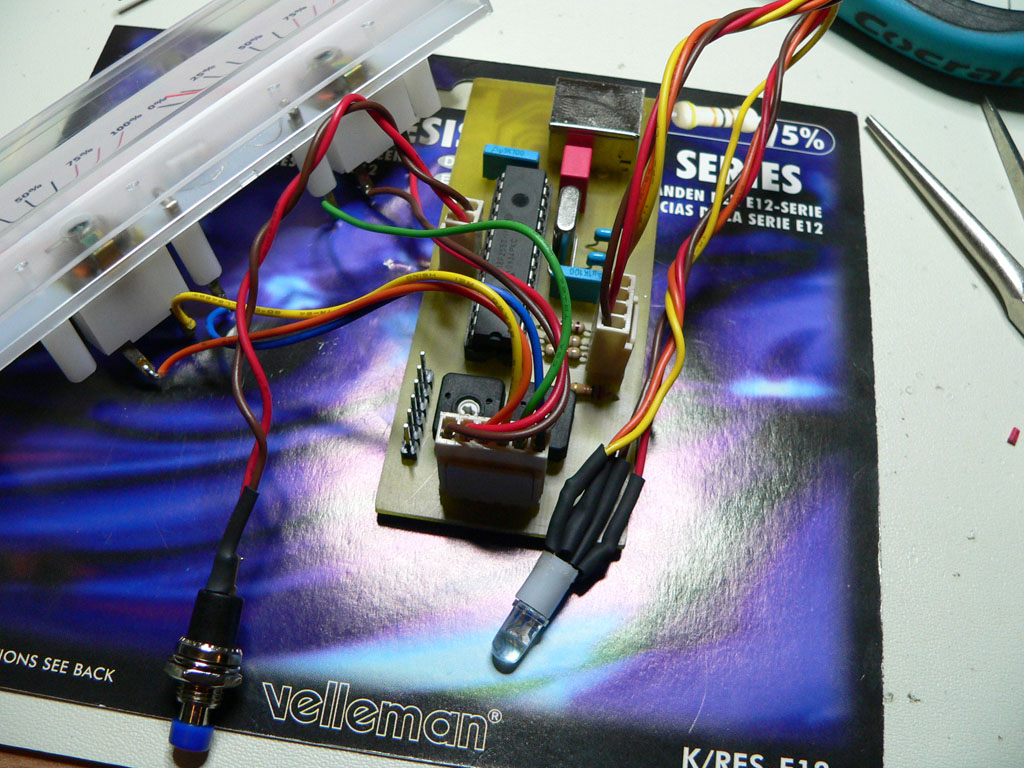
All of the connected devices connect using Molex style connectors to allow the device to be easily assembled and dissembled. I’ve also include a header for the PICkit 2 programmer to make it easier to develop the firmware by programming the PIC in-circuit.
Here is a picture of the finished PCB with all of the peripheral components connected:
RGB LED
The RGB LED I used was a clear-lens LED, this meant that the colour mixing was difficult to see close-up and also the LED was very intense. To cure this I diffused the LED lens by buffing it using a Dremel until the lens was milky-white. If you don’t have a Dremel you can do the same trick by simply rubbing the lens with fine sandpaper.
VU Meter
To re-purpose the VU meter I took the front plastic off the meter and used a sharp knife to cut down behind the existing panel marker. Be very careful when doing this; always cut down and away from yourself! You need to be careful not to push the panel marker up into the needles or you will bend them.
Once the panel marker was removed I placed it in my scanner and scanned an image of it into Photoshop (this is a good trick since it preserves the scale of the original). I then used Photoshop to replace the logarithmic VU markings with a linear percentage scale (more about the logarithmic vs linear scales later!).
Here is my final design:

Once I had my desired design I simply printed it out onto thick glossy photo paper and then cut it out using a steel ruler and a knife. The new panel marker was then reattached to the meter (using a strip of double-sided tape) and then the meter was reassembled.
Although this is a simple trick for re-purposing meters, it’s useful for a number of different projects.
Enclosure
Here is a photograph of the device mounted in the plastic enclosure:
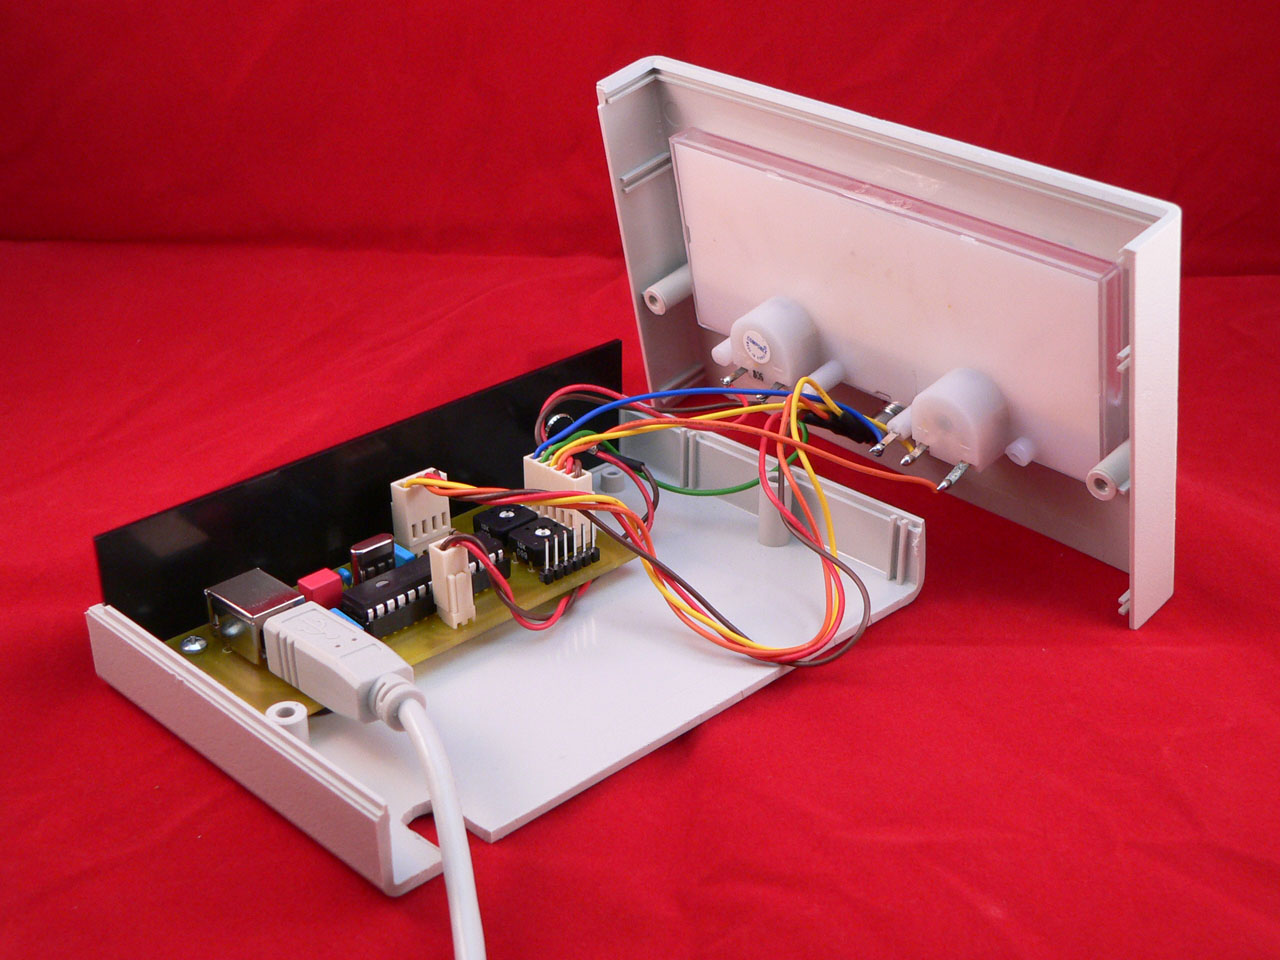
Firmware
PWM Meter Control
The firmware controls the position of the two meters using the two inbuilt PWM generator modules included in the PIC18F2550. This allows accurate PWM with 10-bit resolution without placing a strain on the processor itself. The firmware accepts a percentage between 0 and 100 and sets the appropriate duty-cycle to make the needles move.
The only issue here is that VU meters are logarithmic (look at the distances on the original marking panel, you will see that the dB markings are not even, there is far more movement per dB on the right of the meter).
This means that at 50% duty-cycle the needle will be pointing right, not straight up as we need it to be. To convert from a linear scale to a logarithmic scale requires a little work and some mathematics.
Firstly I set the device up and connected a multimeter to the PWM output from the PIC to measure the effective mV output. I then loaded some test firmware on the PIC which allowed me to vary the duty-cycle. As the duty cycle increased I measured the mV output require to get 25%, 50%, 75% and 100% on the new scale. This allows you to plot a graph showing the relationship between the mV input and the displayed percentage:
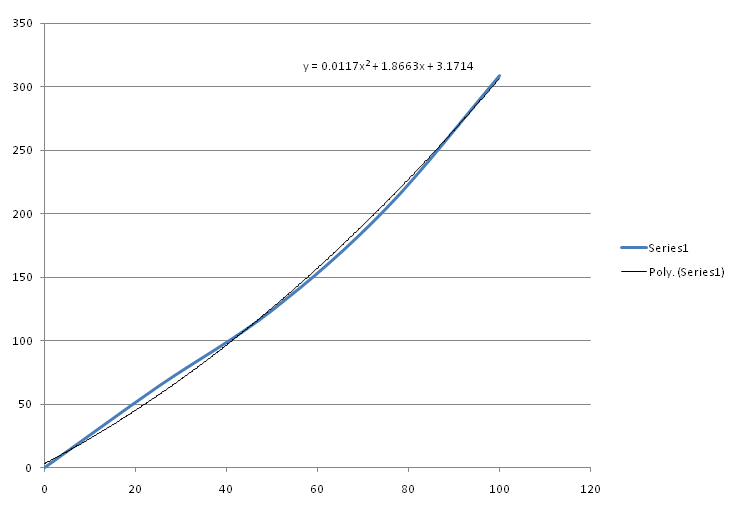
As you can see in the picture, once I had the approximation of the logarithmic output curve I used Excel’s trend-line feature to calculate a polynomial approximation for the curve. This calculation was then copied into the firmware allowing the PIC to calculate the correct PWM duty-cycle base on the desired percentage.
LED PWM Colour mixing
For the RGB LED the device required 3 more PWM channels, since the 2 inbuilt PWM generators are used by the VU meter this had to be achieved using interrupt driven PWM generation. The PWM cycle of the LED colours is 60Hz and gives 128 levels of brightness.
To get ‘correct’ colour mixing on the RGB LED it’s important to consider the relative brightness levels of the colours, the RGB LED does not output uniform brightness levels across the different colours. This will lead to badly matched brightness levels when you try to get particular RGB combinations. To get around this issue I set up a photo-transistor on a breadboard connected to a multimeter. The photo-transistor outputs a varying voltage depending on the amount of light it receives (think of this as a cheap light-meter!).
By taping the RGB LED and the photo-transistor together using black tape I was able to set the PWM of each colour at varying levels The voltage output by the photo-transistor for each colour and level was then plotted in a graph using Excel. In the following graph you can see that red is the brightest colour, followed by blue and then green:
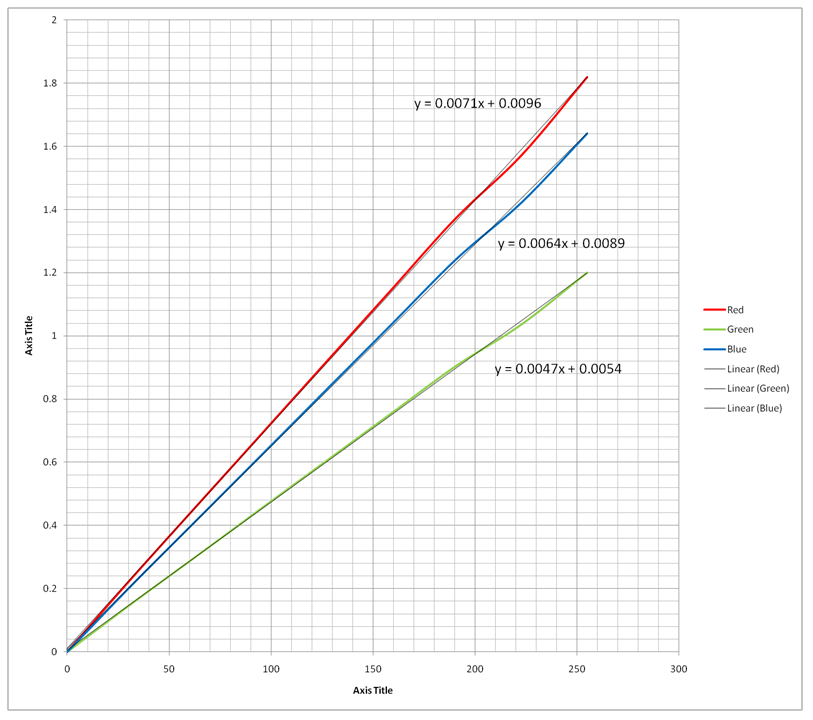
Again, using the trendline function in Excel plot a linear trendline you get the calculation required for approximating the LED output given a known input power.
Using the green LED as the reference (since it is the lowest brightness) you can then calculate the rest. The next part of this section contains the actual maths details; close your eyes and scroll down past the next section if you don’t like this stuff!
LED Brightness mathematics
The output of each colour is measured using a phototransistor connected to a 5V supply and a multimeter. A 256 step resolution PWM is applied to the LED and brightness is output from 0-255 in steps of 32 levels.
The voltage output of the red, green and blue is measured separately. All three colours show a linear output.
From the results, linear trendlines are drawn from 0 to 255 showing the predicted light level at all power outputs.
The colour with the lowest maximum intensity (green) is used with 0 representing off and 255 representing maximum brightness.
The other two colours are scaled according to the trendline multiplier:
Red = 0.0071 * x
Blue = 0.0064 * x
Where x is the PWM step. We then have to scale the result according to the range of the lowest intensity colour (green) so for red, if x = 187:
Scaled intensity = (255/1.1985) * (0.0047 * x)
Where 1.1985 is the maximum output of the green LED and 255 is the number of steps in the scale.
Then to get the required PWM output (x) from the scaled intensity (y) we simply solve the equation in terms of x and simplify:
x = 47 * y / 71
So if our ‘relative to green’ brightness is 255, red’s actual PWM output should be 168.8.
Blue is calculated exactly the same:
x = 47 * y / 64
To adjust the scale we simply change the last number (71 or 64). If you increase the number the output trendline gets flatter (less light output) and if you decrease it the output trendline gets steeper (more light output). This can be used to adjust to your individual LED.
Push-button
The push button firmware is a simple debounce routine. Once the button is detected as ‘pressed’ the firmware sets a flag which is only cleared after the event has been passed to the USB host.
Windows Software
The Windows software is written in C# and allows you to configure the USB device to display a number of difference performance counters on the meters. You can monitor the following items:
- Processor utilisation (total or per-core)
- Harddrive utilisation (total or per physical drive)
- Memory utilisation
- Network utilisation (per card/device)
Here is a screenshot of the application in action:
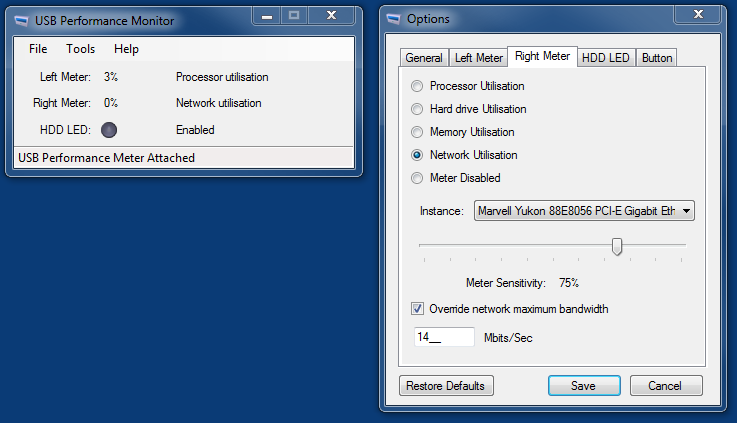
In addition the network monitoring allows you to override the default ‘bandwidth’ (which would be 1000 Mbits/sec for a high speed Ethernet card) and set it to a lower level. I usually have this set to 14Mbits/sec which is the maximum bandwidth of my broadband connection. You can also configure the HDD LED to set the colour that should be displayed if the drive is writing, reading or both. You also have the option to vary the intensity of the displayed colour based on the utilisation of the drive, so if the drive is heavily used the LED will become brighter.
Of course, what you set the meters to display probably depends on the marking panel you made for the VU meter, however you have the option of quickly changing the settings if you need to monitor something else temporarily.
The application also supports showing the HDD LED status in the taskbar. This is useful if you want both the USB device and the desktop to show what your harddrives are up to. Since you probably want the application to be running in the background whilst you are using the machine, there are various options to allow you to hide the main application window.
The application also allows you to set the function of the hardware button on the device. You can use this to disable the meters, LED or both. There is an additional ‘disable USB’ option which causes the PIC to turn off the USB port. This is useful if you have a KVM switch and want to temporarily disable the device before switching machines.
If you want more details about the functions the application provides I suggest you take a look at the YouTube video above which includes a simple walk-through of the options.
Files for download
Visual Studio 2008 C# Host Application project:
USB_Performance_Monitor_V2_1_Project
MPLAB Hi-tech C firmware project for the PIC18F2550:
USB_Performance_Meter_V2_PIC_firmware
Schematic and PCB Artwork:
USB_Performance_Monitor_PCB_and_SCH_V2
Windows MSI installation file (in a zip) – (Use this if you don’t want to compile the Windows application yourself):
Donate to waitingforfriday.com:
If you like this site and want to help support future projects, or you just want to show appreciation for a project you built, used or enjoyed, please consider leaving a PayPal donation. It’s quick, secure and helps us to run the site and fund future projects!

Would you ever consider making this for someone? It’s awesome and I’m interested in something like this for an HTPC. I’d pay you, of course. Thanks.
I don’t do commissioned builds but, since the design is open, you can always contact a local hackerspace. There are also resources on the web where you can request bids on such work.
I’ve searched for custom bid work, but I’m always dubious about who’s reputable.
Sorry, but how do I find a “hackerspace”? I’m so naive about that stuff.
Usually Google is your friend for finding such resources. Simply google “hackerspace Stockholm” – replacing Stockholm with wherever you are.
Hello! Thanks for sharing you project 😉
Would you consider do enhance it more? Here is what I have in mind (that I did see in another similar project). Would be excellent to have option to use existing RGB LED as an additional CPU load signal, along with gauge. OR, add another RGB LED for that to free controller ports. I will explain why. I agree, that analog gauge is good to see “with a corner of your eye” what is going on with CPU load. But, color coded signal would be also welcome – you don’t really need to look that way at all, your peripheral vision will know that color has changed from green to yellow or red. Could you be interested to make such addition? Thank You. Have a good day! 🙂
Hi, glad you liked the project! I built this quite a while ago (and I’m now busy building other things) – but, it’s completely open-source and everything is provided on the project page – so you are quite welcome to build on it, modify it and extend it in any way you like. Why not build one and have a play with it? 🙂